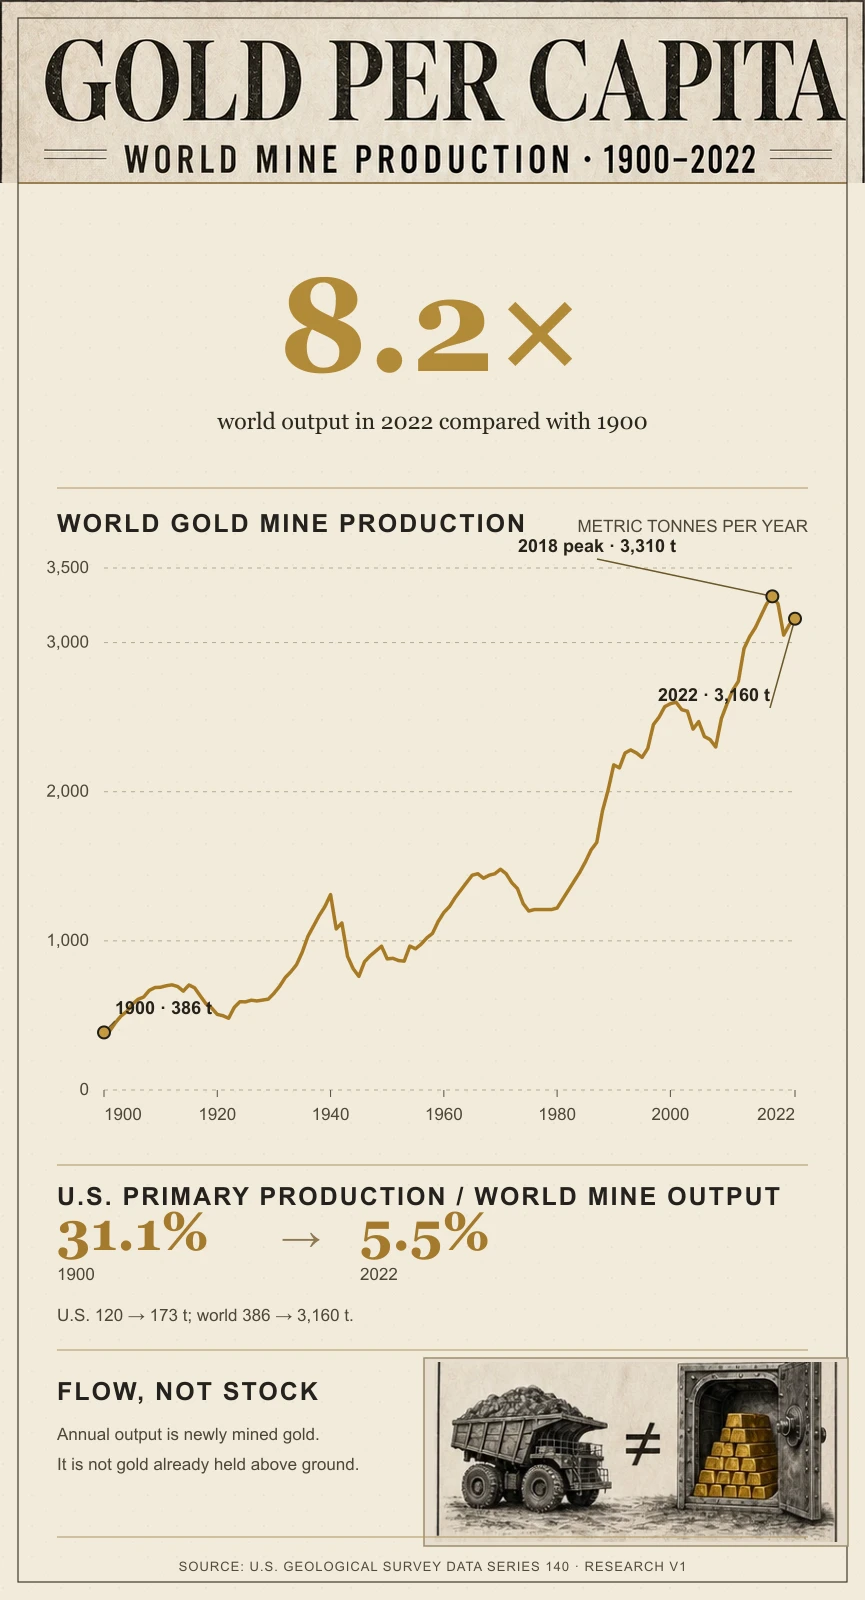
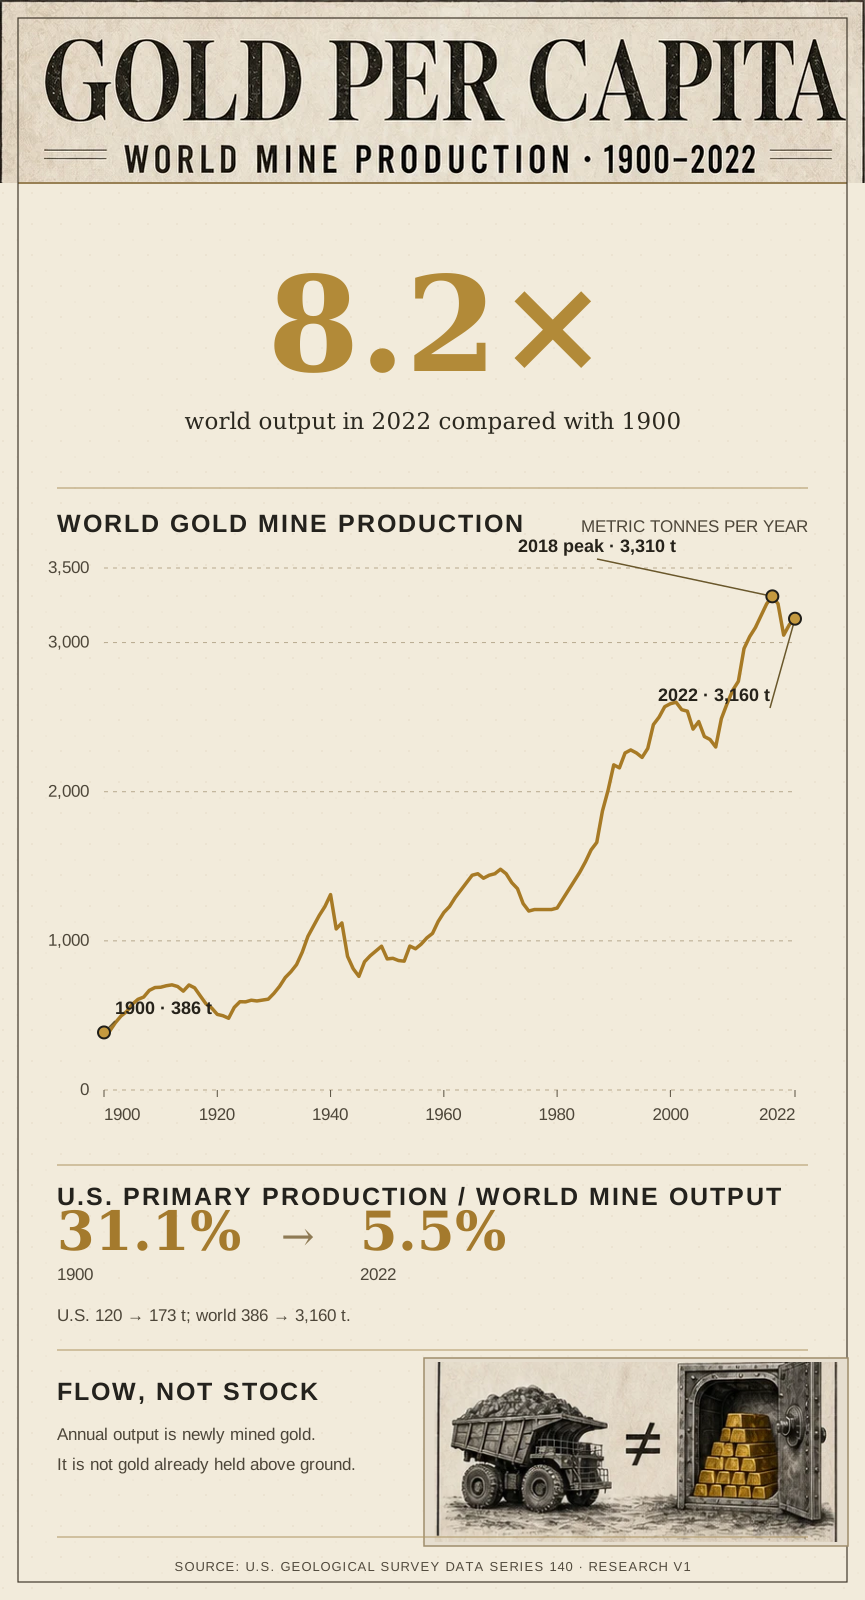
USGS history shows annual world gold mine production increasing from 386 metric tonnes in 1900 to 3,160 tonnes in 2022. U.S. primary production grew more slowly, from 120 to 173 tonnes.
Coverage1900–2022Primary sourceU.S. Geological Survey Data Series 140Published2026-09-26
World mine output reached 3,160 tonnes in 2022, 8.2 times its 1900 level. The line positions all 123 annual observations by year.
The USGS annual world series begins at 386 tonnes in 1900, reaches 1,310 in 1940, 1,220 in 1980, 2,590 in 2000 and a 3,310-tonne peak in 2018, then ends at 3,160 in 2022. The separate U.S. comparison divides primary production by world mine production: 120/386 in 1900 and 173/3,160 in 2022. Mine output is an annual flow, not above-ground stock.
1900 world output386 tMetric tonnes per year2022 world output3,160 t8.2× the 1900 totalU.S. primary / world mine5.5%2022 source-series quotient
World gold mine production in metric tonnes. Source values are available in the linked data table and downloads.
Sources, methods and reusable data
The chart, axes and labels come from the published data; the engraved artwork is decorative. Read the source notes or download the underlying data.